Hello!
When we want to organize reports with a certain frequency (i.e., we need to view, for example, only the data for a month or a quarter, based on a ‘date’ field), we are viewing totals and want the totals to change depending on the time period observed. The issue we have is the following one:
-
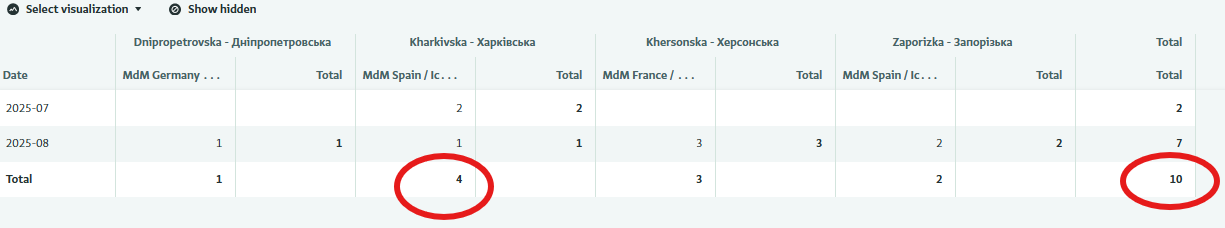
If we hide the columns or rows of the months that do not interest us in the pivot table, the totals do not change (as in Excel, after all).
-
If we put the date field in the filter, we cannot sort by month/week/year (which is possible if we put it in columns or rows).
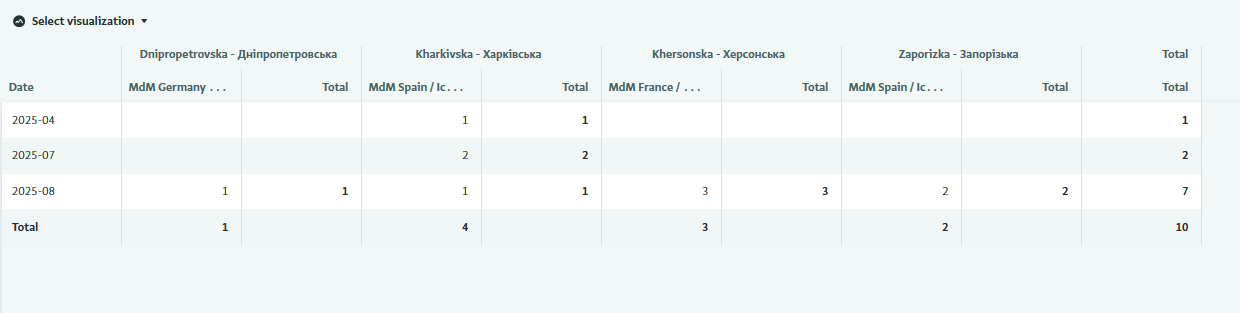
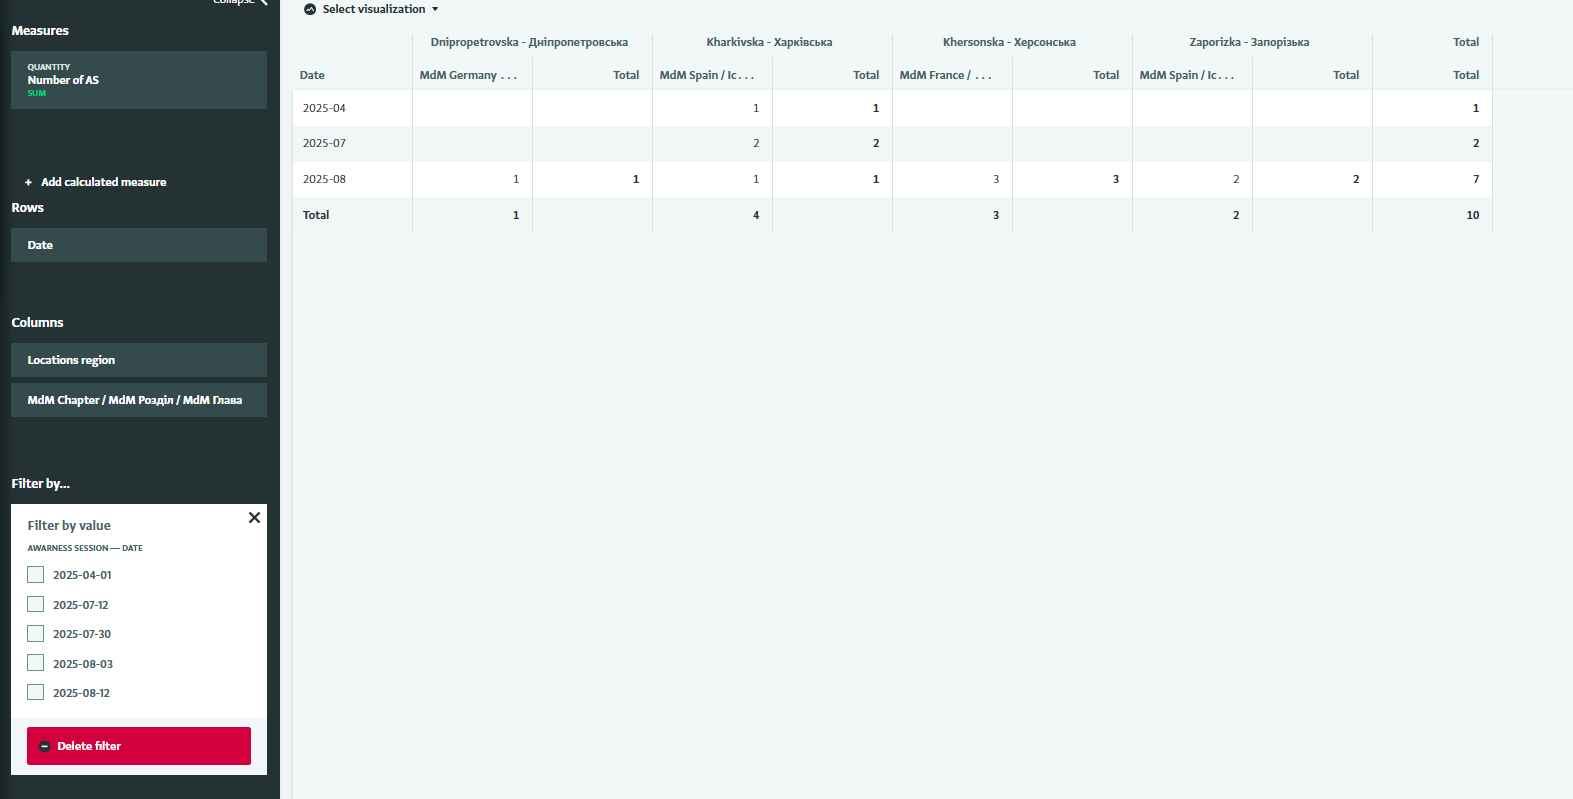
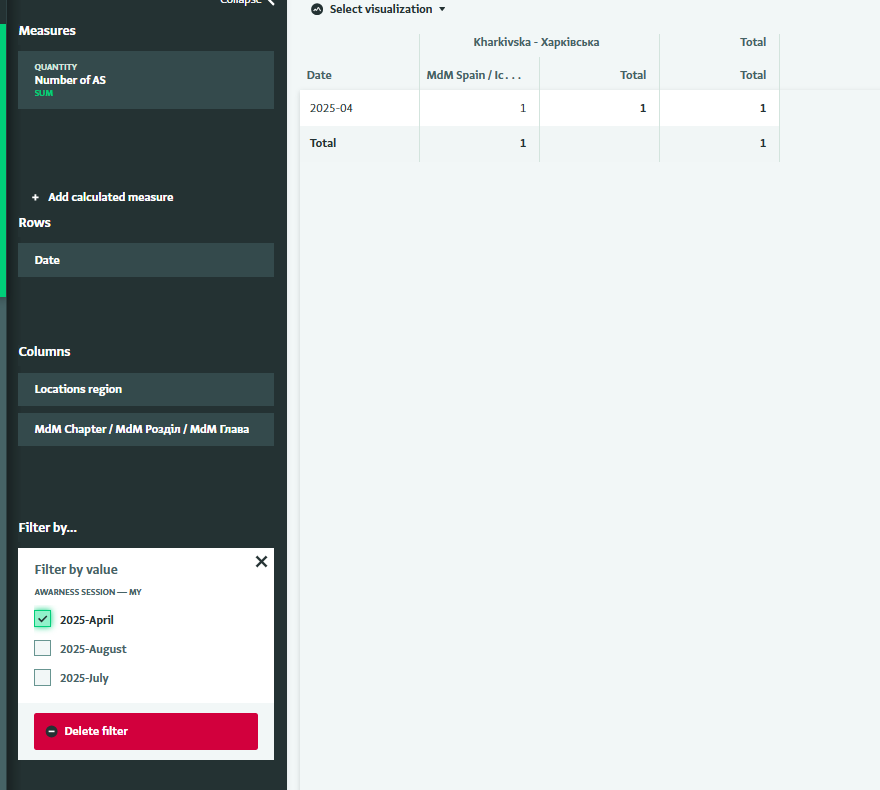
The solution we have found is to create a calculated field that calculates the month and year from the date (Example: CONCAT(TEXT(Date, “YYYY”), “-”, TEXT(Date, “MMMM” → 2025-September)) and then use this field to filter.
Is there a plan in the future to make it possible
a) to organize the date field by months, quarter, years, etc. in the filter as well, or
b) to change the totals when hiding columns or rows?
Thanks